My Live Poker Profit Graph: A Record of 303 Hours of 1/2 and 2/5 Sessions
A Reddit user shares their live poker profit graph over 303 hours, covering $1/2 and $2/5 No-Limit Hold'em, showing the swings and growth of long-term play.
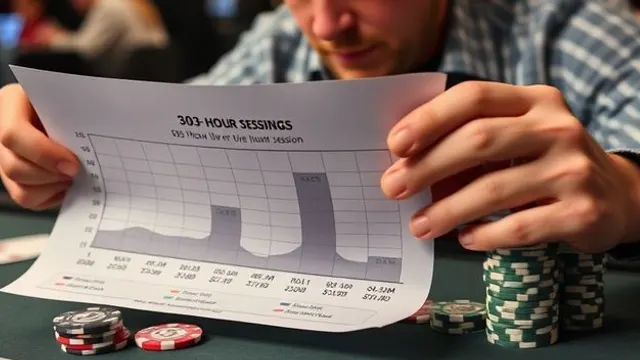
A recent post by Reddit user Zedaxx on r/livepoker shared a profit curve chart from 303 hours of live poker. The chart records his performance in $1/$2 and $2/$5 No-Limit Texas Hold'em games, offering a clear look at the ups and downs and trends over an extended period of play.
For many poker enthusiasts, such profit curve charts are crucial tools for evaluating their skill level and reviewing decisions. While 303 hours is not an extremely large sample size, it already reflects the player's ability to adapt to different stakes and opponents. The chart shows typical variance: there may be significant swings early on, but as experience accumulates, the curve gradually stabilizes into an upward trend.
Notably, live poker differs significantly from online poker in terms of pace, reading tells, and emotional control. Sticking with it for 303 hours and consistently keeping records itself shows discipline and passion. The post sparked community discussions on live poker profit statistics, bankroll management, and mental adjustment.
If you also have your own profit curve, feel free to share it like Zedaxx did—not only as a review of your own efforts but also as a reference for other players.
FAQ
- $1/$2 and $2/$5 are common blind levels in live poker. The $1/$2 level is lower, usually with looser players, while $2/$5 level is higher, with stronger overall player skill and higher variance. Many players start at $1/$2 and gradually move up to $2/$5.